Most traders think of Bollinger Bands as simple overbought/oversold lines. Price touches the upper band—sell. Touches the lower band—buy. Easy, right?
Not quite. That approach will lose you money more often than not.
The real power of Bollinger Bands lies in what they tell you about volatility—and volatility is what separates choppy, frustrating markets from the explosive moves that can make your year.
Let's dig into how these bands actually work and how to read them properly.
Who Created Bollinger Bands?
John Bollinger developed his bands in the early 1980s while working as a market technician. Unlike many indicators borrowed from other fields, Bollinger Bands were designed specifically for financial markets.
Bollinger's key insight was simple but powerful: volatility isn't constant. Markets go through periods of calm, followed by periods of chaos. Fixed percentage bands (like the envelopes traders used before) couldn't capture this rhythm.
His solution? Bands that breathe with the market—expanding during volatile periods and contracting during quiet ones.
The Three Components of Bollinger Bands
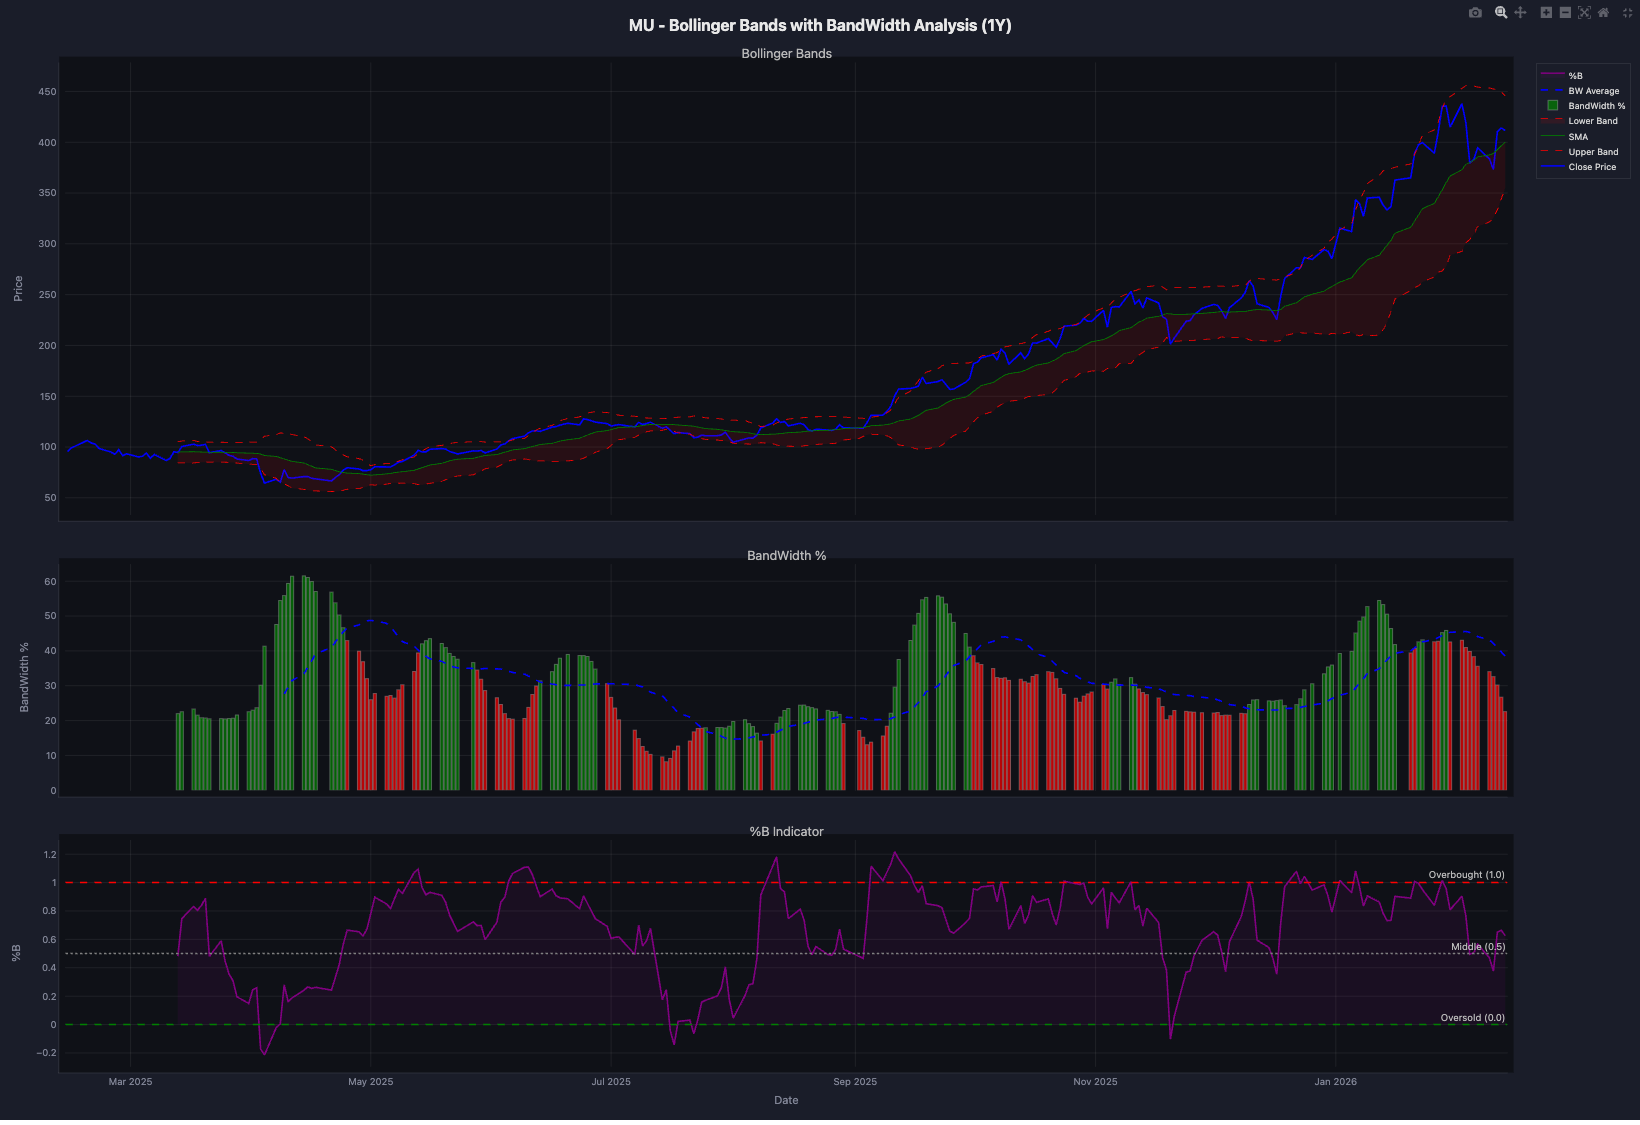
Look at this chart of Micron (MU) from StockIceberg. It shows all three pieces of the Bollinger Band puzzle:
The Top Panel: The Bands Themselves
This is what most people think of when they hear "Bollinger Bands":
-
Middle Band (Green Line): A 20-period simple moving average. This is the baseline—where price tends to gravitate over time.
-
Upper Band (Red Dashed): The middle band plus two standard deviations. In statistical terms, roughly 95% of price action should stay below this line.
-
Lower Band (Red Dashed): The middle band minus two standard deviations. Again, about 95% of prices should stay above this.
-
The Shaded Area: The space between the bands. Notice how it expands and contracts—that's volatility in visual form.
The Middle Panel: BandWidth %
Here's where it gets interesting. BandWidth measures how wide the bands are as a percentage:
BandWidth = (Upper Band - Lower Band) / Middle Band × 100
The bar chart shows this value over time:
- Green Bars: BandWidth is expanding—volatility is increasing
- Red Bars: BandWidth is contracting—volatility is decreasing
- Blue Dashed Line: The average BandWidth—useful for context
Why does this matter? Because low volatility leads to high volatility. When BandWidth gets extremely tight, something is about to happen. Traders call this "the squeeze."
The Bottom Panel: %B (Percent B)
%B tells you exactly where price sits within the bands:
%B = (Price - Lower Band) / (Upper Band - Lower Band)
The readings work like this:
- 1.0 = Price is at the upper band
- 0.5 = Price is at the middle (the 20-day average)
- 0.0 = Price is at the lower band
- Above 1.0 = Price has broken above the upper band
- Below 0.0 = Price has broken below the lower band
The chart marks these key levels clearly. Notice how %B oscillates between the overbought and oversold zones, occasionally breaking beyond.
Reading the MU Chart: A Case Study
Let's walk through what Micron's chart actually tells us.
February-April 2025: The Quiet Before the Storm
Look at the BandWidth panel during this period. See how the bars shrink to some of the lowest levels on the chart? That's the bands contracting—volatility drying up completely.
Meanwhile, price is bouncing in a tight range between roughly $70 and $130. The market is coiling like a spring.
This is classic squeeze behavior. Experienced traders watch for these moments because they often precede significant moves.
May-July 2025: The Breakout
Around May, everything changes. BandWidth starts expanding (green bars getting taller), and price begins climbing decisively through the upper band.
Watch %B during this period—it spends considerable time above 0.8 and even breaks above 1.0 multiple times. This isn't a sell signal. When a stock is in a strong uptrend, it's supposed to ride the upper band.
The old "sell when price touches the upper band" rule would have kicked you out of a move that went from $130 to over $400.
November 2025-January 2026: Peak Volatility
By late 2025, MU has quadrupled. BandWidth hits its highest readings of the year—the bands are at maximum expansion. Price is swinging wildly, touching both bands.
Notice how %B becomes more erratic during this phase, bouncing rapidly between extremes. This is typical of late-stage trends when volatility is elevated but direction becomes uncertain.
The Bollinger Squeeze: Where the Money Is Made
The squeeze is the single most actionable Bollinger Band signal. Here's how to identify one:
- BandWidth drops below its 6-month average (or lower—the tighter, the better)
- The bands visually narrow to some of the tightest levels on the chart
- Price consolidates in a tight range
The squeeze doesn't tell you which way price will break—just that a significant move is coming. For direction, you'll need other tools: trend analysis, support/resistance, volume patterns.
What makes the squeeze so powerful is that it appears before the move happens, giving you time to prepare rather than chase.
Common Bollinger Band Mistakes
Mistake 1: Fading Every Touch of the Bands
Price touching the upper band isn't automatically bearish. In uptrends, price will "walk the band"—staying near or above the upper band for extended periods. The MU chart demonstrates this perfectly from May through November.
Better approach: Only fade band touches when BandWidth is elevated and %B shows divergence or other weakness.
Mistake 2: Ignoring BandWidth
Most traders watch the bands but ignore the BandWidth panel. That's like checking your speedometer but ignoring the fuel gauge.
BandWidth tells you the market's state:
- Low BandWidth: Expect a breakout—prepare for directional moves
- High BandWidth: Volatility may be peaking—consider tightening stops
Mistake 3: Using %B as a Standalone Signal
%B hitting 0 or 1 is not an automatic trading signal. Context matters:
- In a trend, %B extremes confirm the trend's strength
- In a range, %B extremes suggest reversal opportunities
Always ask: what's the bigger picture?
Bollinger Band Settings
The standard settings are:
- 20-period moving average
- 2 standard deviations
These work well for daily charts. For other timeframes:
| Timeframe | Suggested Period | Notes |
|---|---|---|
| Weekly | 20 | Standard works well |
| Daily | 20 | The classic setting |
| 4-hour | 20-30 | Slightly longer can smooth noise |
| 1-hour | 20-50 | Intraday noise requires adjustment |
Some traders use 1.5 or 2.5 standard deviations instead of 2. Tighter bands give more signals (and more false signals). Wider bands catch only the most significant moves.
Combining Bollinger Bands with Other Indicators
Bollinger Bands work best as part of a broader toolkit:
Bollinger + RSI
When %B shows oversold (below 0.2) and RSI is oversold (below 30), you have confirmation. Both volatility and momentum are saying the same thing.
Bollinger + Volume
Breakouts from a squeeze should come with expanding volume. A squeeze breakout on light volume is suspicious—it might be a false move.
Bollinger + ADX
Use ADX to confirm whether you're in a trending or ranging market. This tells you how to interpret band touches:
- ADX above 25 (trending): Let winners ride the band
- ADX below 20 (ranging): Consider fading band extremes
Key Takeaways
- Bollinger Bands measure volatility, not just overbought/oversold conditions
- BandWidth shows the squeeze—low volatility precedes high volatility
- %B quantifies position within the bands (0 to 1, with breakouts beyond)
- Don't automatically fade band touches—in trends, price walks the bands
- Watch for divergences between %B and price for reversal signals
- Context is everything—combine with trend analysis and other indicators
- The squeeze is your edge—it appears before the move, not after
Putting It All Together
The Micron chart tells a complete story. Months of compression (tight BandWidth, narrow bands) gave way to an explosive uptrend. Traders who recognized the squeeze and positioned for a breakout captured a 300%+ move.
You don't need to predict direction to profit from volatility. Sometimes the most valuable information isn't where price is going—it's knowing that something significant is about to happen.
Bollinger Bands won't tell you everything, but they'll tell you something most indicators miss: when the market is about to wake up.
Technical indicators are tools for analysis, not guarantees. Always manage your risk and consider multiple factors before trading.