Most technical analysis tools show you what already happened. A pattern forms, you see it, and by then the move is half over.
What if you could detect a pattern while it's still forming? Better yet, what if you could learn which patterns tend to follow each other—and trade the chain before it completes?
That's exactly what we built at StockIceberg. This post walks through our three-layer candlestick analysis system: classical pattern detection, Ichimoku Cloud integration, and a sequence recognition algorithm that learns recurring pattern chains from historical data.
Candlestick Patterns: The Foundation
Japanese candlestick charting dates back to the 18th century, when rice trader Munehisa Homma realized that price action told a story beyond simple supply and demand. Each candle encodes four data points—open, high, low, and close—into a single visual shape. The body shows the gap between open and close. The shadows (or wicks) show how far price traveled before pulling back.
This is deceptively rich data. A candle with a small body and a long lower shadow tells you that sellers pushed price down hard, but buyers stepped in and drove it back up. That's a Hammer—a bullish reversal signal.
What StockIceberg Detects
Our classical pattern detector recognizes 48+ candlestick patterns across four categories:
Single-Candle Patterns
- Doji: Body less than 5% of total range. Pure indecision—neither buyers nor sellers won the session.
- Hammer: Small body at the top, lower shadow at least 2x the body. Sellers tried, buyers won.
- Shooting Star: Mirror image of the Hammer. Buyers pushed high, sellers slammed it back down.
Two-Candle Patterns
- Bullish Engulfing: A red candle followed by a larger green candle that completely engulfs it. Strong reversal signal—85% historical success rate in trending markets.
- Bearish Engulfing: The opposite. A green candle swallowed by a larger red one.
- Piercing Line / Dark Cloud Cover: Partial engulfing patterns that signal reversals with slightly less conviction.
- Tweezer Top / Tweezer Bottom: Two candles with matching highs or lows, signaling a double rejection of a price level.
Three-Candle Patterns
- Morning Star: Red candle, small-body candle (the "star"), green candle. The classic bottoming pattern. We assign 80% confidence when the star's body is less than 30% of the first candle's body.
- Evening Star: The bearish mirror. Green, star, red.
- Three White Soldiers / Three Black Crows: Three consecutive strong candles in the same direction with progressively higher closes (or lower). 80% confidence—this is momentum confirming itself.
Five-Candle Patterns
- Rising Three Methods: A long green candle, three small red candles contained within its range, then another long green candle. Bullish continuation—the pullback was just a pause.
- Falling Three Methods: The bearish equivalent.
Each pattern gets a confidence score (0-100%), a historical success rate from academic research, and a clear signal: bullish, bearish, or neutral.
A Research-Backed Edge
Our detector also flags statistically significant sequences that aren't in the traditional textbooks:
- 3+ Consecutive Red Candles: 65.4% probability of bullish reversal within the next 5 sessions
- 3+ Consecutive Green Candles: 41.9% probability of bearish reversal
These numbers come from backtesting across thousands of stocks. The asymmetry is interesting—panic selling exhausts itself more reliably than euphoric buying.
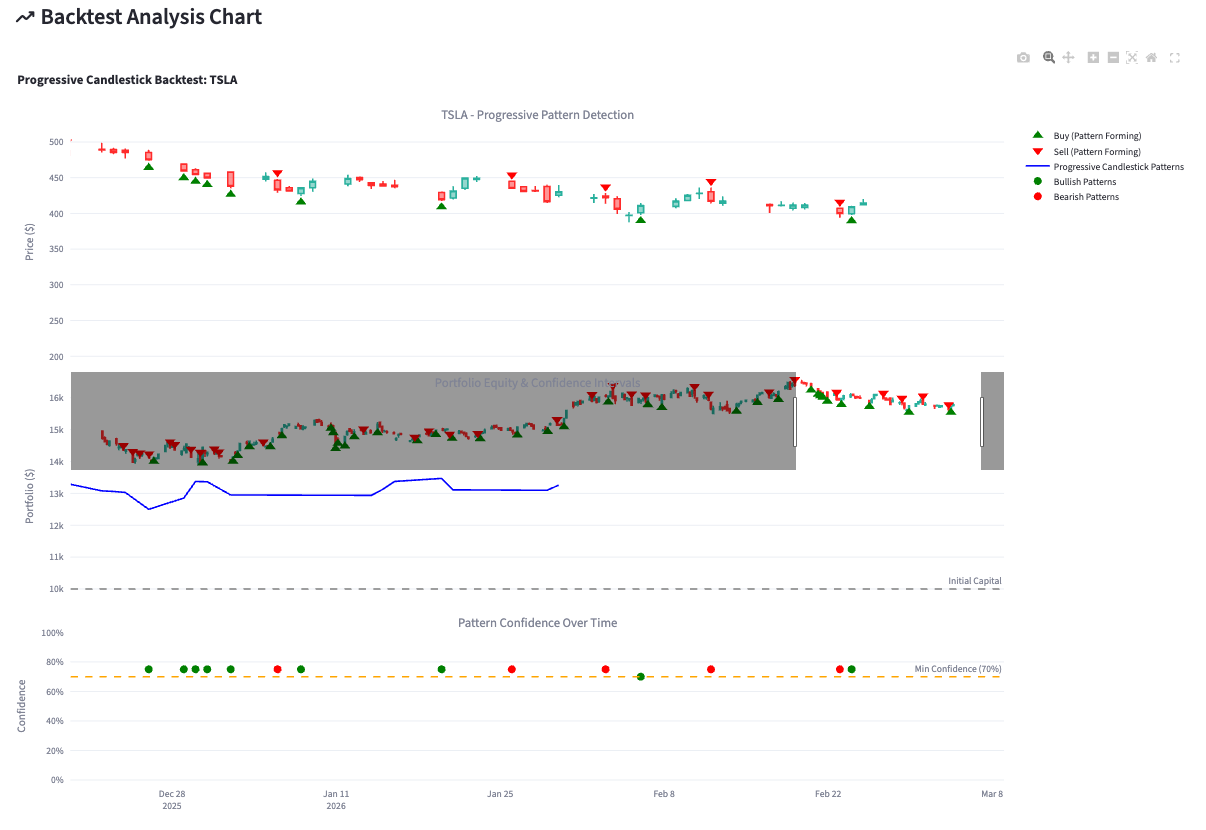
Progressive Detection: Catching Patterns Before They Complete
Here's where StockIceberg diverges from conventional tools. Most pattern detectors wait for a pattern to fully form before alerting you. By then, you're entering late.
Our Progressive Pattern Detector identifies patterns as they develop, across four stages:
| Stage | Candles | Confidence | Action |
|---|---|---|---|
| Early | 1-2 | 20-40% | Watch list |
| Forming | 3-4 | 50-70% | Prepare entry |
| Confirming | 4-5 | 80-95% | Execute trade |
| Complete | Full | 95%+ | Pattern confirmed |
The sweet spot is the Forming stage. At 50-70% confidence, the pattern is recognizable enough to act on, but early enough that you're ahead of traders waiting for full confirmation.
For each candle in the window, the detector calculates:
- Body size and color (bullish vs. bearish)
- Upper and lower shadow ratios
- Range size relative to recent history
- Volume compared to the 20-day average
- Whether the candle classifies as a Doji, Hammer, or Shooting Star
These characteristics feed into pattern templates. When 3 of 5 candles match a Morning Star template at the Forming stage, you get an alert—not after the pattern is done, but while it's still developing.
The Ichimoku Cloud: Context for Every Signal
Candlestick patterns are powerful, but they need context. A Bullish Engulfing pattern means very different things depending on whether price is above or below a major trend indicator. That's where the Ichimoku Cloud comes in.
Developed by Goichi Hosoda in the late 1960s (after 30 years of research), the Ichimoku Kinko Hyo—"one glance equilibrium chart"—is one of the most complete single-indicator systems in technical analysis. It shows support, resistance, trend direction, and momentum all at once.
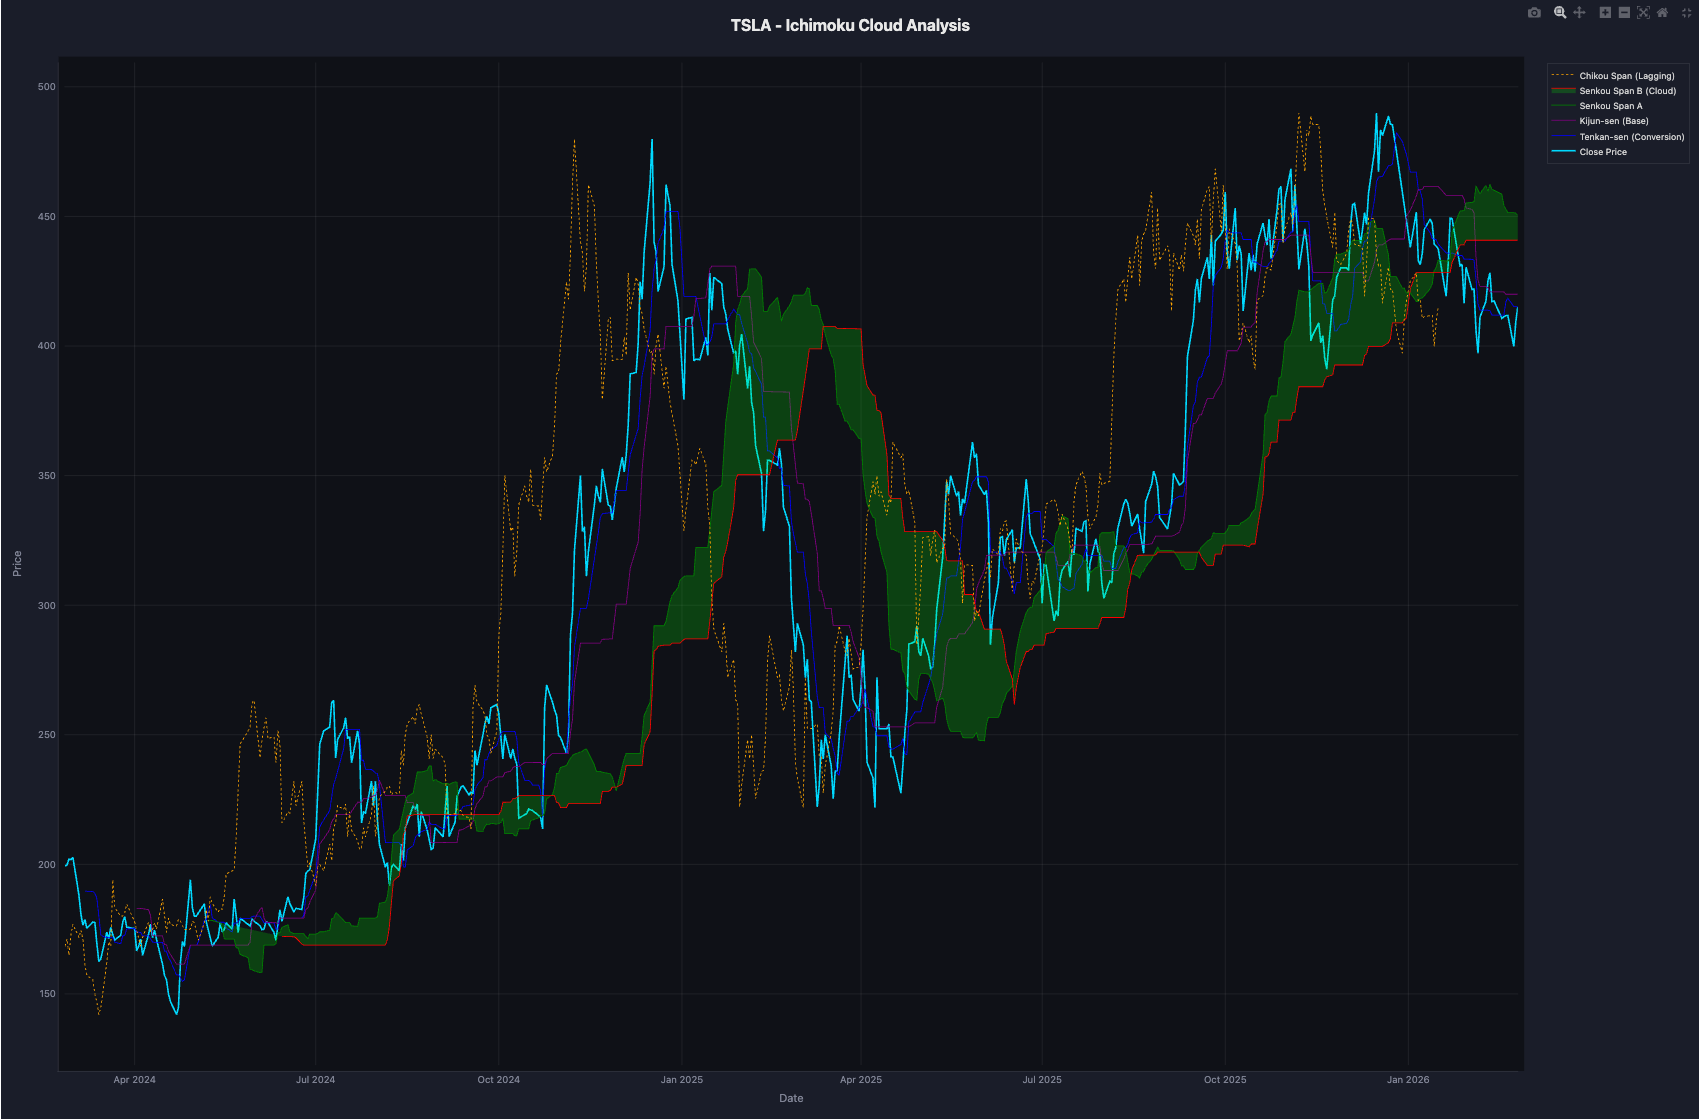
The Five Components
1. Tenkan-sen (Conversion Line) — 9-period midpoint
Tenkan = (9-period High + 9-period Low) / 2
This is your short-term trend. When price is above the Tenkan, short-term momentum is bullish.
2. Kijun-sen (Base Line) — 26-period midpoint
Kijun = (26-period High + 26-period Low) / 2
Your medium-term trend and the most important line for signal generation. The Kijun acts as a magnet—price tends to return to it after extended moves.
3. Senkou Span A (Leading Span A) — Future cloud boundary
Senkou A = ((Tenkan + Kijun) / 2), plotted 26 periods ahead
4. Senkou Span B (Leading Span B) — Future cloud boundary
Senkou B = ((52-period High + 52-period Low) / 2), plotted 26 periods ahead
The space between Senkou A and Senkou B forms the Cloud (Kumo). When Span A is above Span B, the cloud is green (bullish). When Span B is on top, the cloud is red (bearish).
5. Chikou Span (Lagging Span) — Current close plotted 26 periods back. If the Chikou is above historical price, the current trend has more conviction than the same period in the past.
How StockIceberg Reads the Cloud
Our analyzer generates signals by weighting three components:
| Signal | Weight | Interpretation |
|---|---|---|
| Cloud trend (green vs. red) | 20% | Overall market structure |
| Price vs. Cloud position | 50% | Above = bullish zone, Below = bearish, Inside = decision zone |
| Tenkan-Kijun crossover | 40% | Momentum shifts |
The combined score produces a signal strength from 0-100 with a clear recommendation: BUY, SELL, or HOLD.
Simplified Decision Windows
We also built a simplified Ichimoku view that distills the five components into actionable zones:
- Clear Trend: Price well above or below the cloud. Follow the trend.
- Critical Decision Zone: Price at the cloud edge. A breakout or rejection is imminent.
- Equilibrium: Price inside the cloud. Wait for a directional move.
- Sideways: Flat cloud with no directional bias. Stay out.
Additional metrics include cloud thickness (thicker = stronger support/resistance), Tenkan-Kijun spread, trend consistency score, and breakout probability—all calculated automatically.
The Sequence Detection Algorithm: Where It Gets Interesting
Classical pattern detection answers: "What pattern just formed?" The Ichimoku Cloud answers: "What's the trend context?" But there's a third question nobody was asking:
"What pattern is likely to come next?"
That's the question our Pattern Sequence Analyzer answers. It's a statistical learning algorithm that discovers recurring multi-pattern chains in historical data.
How It Works
The algorithm operates in two phases:
Phase 1 — Training (first 70% of historical data)
- Detect all candlestick patterns across the full training period using the progressive detector
- Find every 2-pattern sequence that occurred within 7 days of each other (e.g., "Bearish Engulfing followed by Bullish Engulfing")
- Find every 3-pattern sequence (e.g., "Three Black Crows, then Hammer, then Morning Star")
- For each unique sequence, calculate:
- Probability: P(this sequence completes | first pattern detected)
- Average return: What happened to price 5 days after the sequence completed?
- Win rate: What percentage of the time was that return positive?
- Average days between patterns: How quickly does the chain unfold?
-
Statistical confidence: Based on frequency (minimum 3 occurrences required)
-
Build a transition matrix: for every pattern X, what's the probability of each pattern Y appearing within the next 7 days? This creates a map of how patterns flow into each other.
Phase 2 — Trading (last 30% of data)
The algorithm applies the learned sequences to unseen data—no look-ahead bias. When pattern X fires and the transition matrix says pattern Y follows with >60% probability, the system flags the setup before Y even appears.
What Makes a Sequence "Significant"
Not every pattern chain is tradeable. The algorithm filters for:
- Probability > 60%: The sequence completes more often than not
- OR Average return > 3%: Even if rare, the payoff justifies the trade
- Minimum 3 occurrences: No flukes—the sequence must have repeated enough to trust
Real-World Example
Consider a stock that shows the following sequence over 2 years of data:
Three Black Crows → Hammer → Morning Star
The algorithm might find:
- This 3-pattern sequence occurred 8 times
- In 6 of those 8 times, price rose an average of +3.8% within 5 days of the Morning Star completing
- Win rate: 75%
- Average gap between patterns: 3.2 days
- Confidence: 80%
A trader monitoring this stock would get an alert when Three Black Crows appear, knowing that historically a Hammer tends to follow within 3 days, and a Morning Star often completes the sequence shortly after—with a favorable risk/reward setup.
The Transition Matrix
Beyond specific sequences, the algorithm builds a full transition matrix showing P(Pattern Y | Pattern X) for every pair. This reveals the "grammar" of price action—which patterns are natural successors to others.
Some transitions are intuitive: Bearish Engulfing is frequently followed by continuation patterns like Three Black Crows. Others are surprising and stock-specific, reflecting the behavioral fingerprint of a stock's particular mix of institutional and retail investors.
Putting It All Together
Each layer builds on the previous one:
- Classical Detection identifies the current pattern and its historical success rate
- Progressive Detection catches it early, while it's still forming
- Ichimoku Cloud provides trend context—is this pattern appearing in a bullish or bearish environment?
- Sequence Analysis predicts what comes next based on learned chains
A Bullish Engulfing detected at the Forming stage, with price above the Ichimoku Cloud, and the sequence analyzer showing a 70% probability that this leads to a Three White Soldiers continuation—that's a high-conviction setup with multiple independent confirmations.
Key Takeaways
- Candlestick patterns work, but context matters. A Hammer inside the Ichimoku Cloud means something different than one above it.
- Progressive detection gives you a timing edge. Trading at the Forming stage (50-70% confidence) means entering before the crowd.
- Patterns don't appear in isolation. Our sequence analyzer learns which patterns chain together with >60% probability—and trades the chain.
- The transition matrix is stock-specific. Each stock has its own "pattern grammar" based on who trades it and how.
- Statistical rigor prevents overfitting. Minimum 3 occurrences, 70/30 train/test split, and no look-ahead bias.
- Ichimoku Cloud provides the trend filter. It tells you whether to trust a reversal signal or fade it.
- All three systems are available in StockIceberg—from classical pattern scanning to Ichimoku decision windows to sequence-based alerts.
Ready to see these patterns in action on your watchlist? StockIceberg's candlestick analysis runs across 30+ technical indicators, with progressive alerts and sequence detection built in.
Candlestick patterns and sequence analysis are statistical tools based on historical data. They do not guarantee future results. Always manage risk and consider multiple factors before trading.